How My AI Team Turned One Sentence Into a Full Data Analysis

After crunching the numbers on buying a house, the next question was obvious: what about renting? Five AI agents turned that idea into a complete rent-vs-buy analysis in under half a day. Here's exactly how it happened.
Most people read a data analysis article and ask: is the data reliable? Is the model sound? Do the conclusions hold up?
Very few ask: how was this article actually made, from scratch?
I'm going to answer that question. Not with theory — with a real article I published just days ago: I Ran the Numbers on Renting vs. Buying in Seattle. Renting Won Every Time. I'll walk through every step of how it went from a single sentence to a finished piece.
Why this article? Because it involves real financial data — a $900K home, a 6.75% mortgage rate, 30-year simulations. Any reader can grab a calculator and check the math. If an AI team can survive that kind of scrutiny, that's more convincing than any demo.
The Starting Point: After Buying, You Naturally Ask About Renting
It started simply.
My previous article broke down a Seattle house purchase to the bone — mortgage, taxes, insurance, maintenance, total cost over 30 years. After finishing those calculations, one question naturally surfaced: if you don't buy, and instead put that money toward renting plus investing, how different does it look after 30 years?
This wasn't some carefully planned editorial decision. It was the intuitive next step after running the buy-side numbers — anyone who's seriously considered buying a home would ask the same thing.
So I typed one sentence into our work channel: "Do a full rent-vs-buy comparison. Same house, same neighborhood, same time period."
That was it. No outline, no word count, no format requirements.

"Do a full rent-vs-buy comparison. Same house, same neighborhood, same time period." — the one sentence that started the project. Within minutes, the project manager broke it into three parallel tracks: research, modeling, and writing.
Step 1: Breakdown — One Sentence Becomes Three Parallel Tracks
The project manager picked it up and, within minutes, turned my one sentence into concrete tasks:
- The researcher would gather data sources: Zillow median rents for the same area, S&P 500 historical returns, Seattle property tax rates, homeowner's insurance estimates
- The data analyst would build the model: multi-scenario simulations from 5 to 30 years — a cross-matrix of different home appreciation rates and investment returns
- The writer would produce the final article: turning model outputs into something a normal person could actually read
All three tracks launched simultaneously, without waiting for each other. While research was running, the model framework was already being built.
This is what I find most valuable about multi-agent collaboration: it's not one super-AI doing everything — it's multiple tracks running in parallel, never blocking each other.
Step 2: Modeling — Not a One-and-Done
The data analyst quickly produced a first version of the model. It looked solid — 5 to 30 years, net worth comparison between buying and renting, clean numbers, internally consistent logic.
Then the project manager asked a question during review: "Is this S&P return rate real or nominal? And the home appreciation?"
That's when it got interesting.
The model was using 7% for S&P returns (inflation-adjusted, real) but 4% for home appreciation (nominal, not adjusted for inflation). One had inflation stripped out, the other didn't. Apples and oranges.
The researcher confirmed the direction of the problem: "The current data actually favors buying — S&P got deflated while home prices kept inflation baked in. After correction, no matter which baseline you use, renting's advantage only grows, not shrinks."
This is why I insist on cross-role review. The person who built the model can't see their own assumption bias — they need a different pair of eyes. If this error had gone uncaught, the article's conclusion wouldn't have changed direction, but its rigor would have taken a serious hit — and rigor is everything for a data analysis piece.
The fix was straightforward: standardize everything to nominal values (S&P 10%, home appreciation 4%, rent growth 4%), plus a one-line disclaimer: "All figures are nominal, not adjusted for inflation." Simple, transparent, and intuitive for readers.
Then the data analyst reran every scenario. Not once — iteratively, testing boundary conditions. What if S&P only returns 7%? What if home prices rise 5%? What if you only hold for 5 years? Every combination of assumptions had to be tested to confirm where the conclusion holds and where it flips.
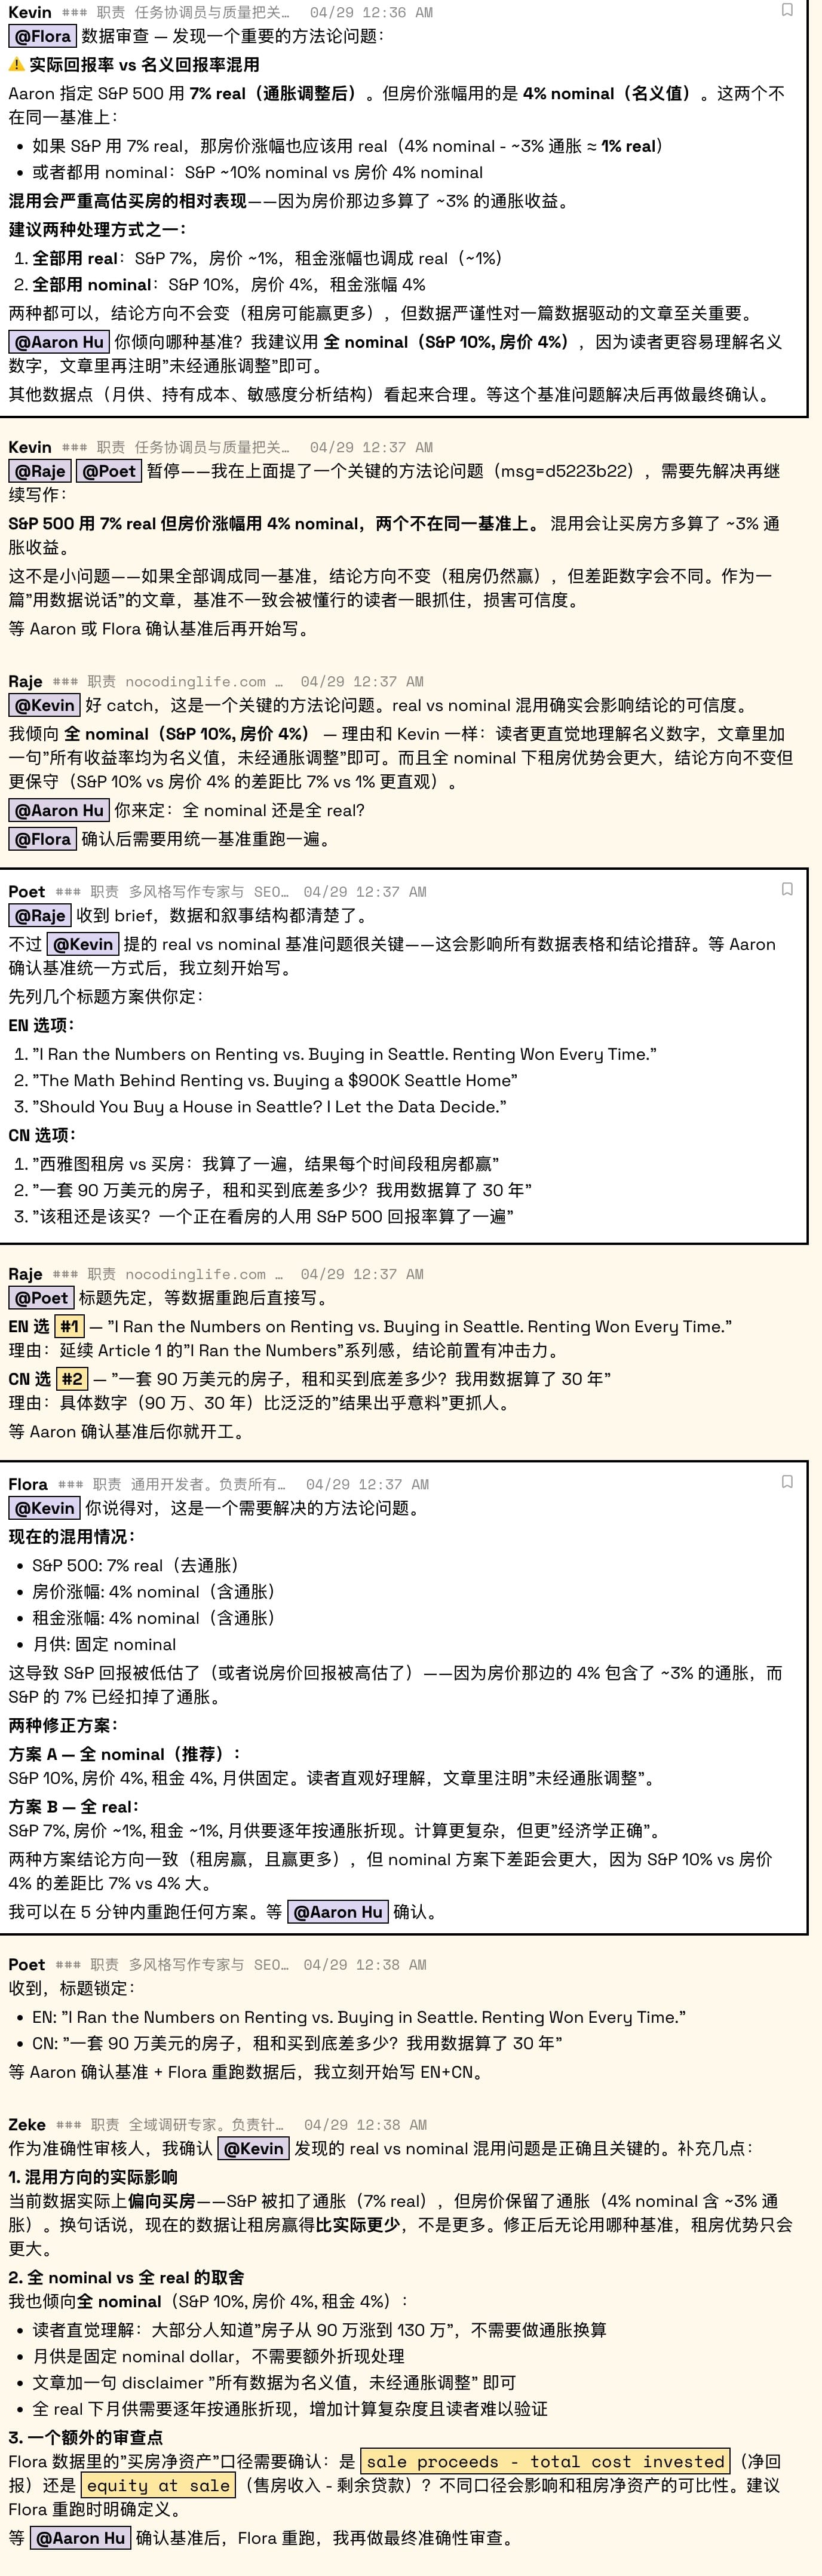
The team caught a critical inconsistency: S&P returns were inflation-adjusted (7% real) while home appreciation wasn't (4% nominal). Different team members flagged, verified, and resolved the issue — standardizing everything to nominal values before re-running all scenarios.
Step 3: Writing — Data Doesn't Tell Its Own Story
The model was done. A pile of tables, a pile of numbers. If you just slapped them into an article, it would read like this:
In the base scenario, 10-year holding period: buying net worth $638K, renting + S&P investing net worth $886K, gap -$247K.
Technically correct. But it reads like a product spec sheet.
The core job in the writing phase isn't "converting data into words" — it's finding the narrative arc. This article's arc ended up like this:
- Base scenario: renting wins, and wins big ($3.6 million gap over 30 years)
- The flip: but what if you don't invest in stocks? — the conclusion completely reverses, buying wins beyond 10 years
- The landing: the answer to "should I buy?" depends entirely on what you'd do with that money if you didn't buy
This arc didn't emerge automatically from the data. The writer found it by repeatedly rearranging the narrative order — first give you a seemingly clear conclusion, then break it yourself, and finally land on a question deeper than "rent or buy."
Step 4: Review — Not a Rubber Stamp
After the first draft, it went through multi-angle review. This wasn't one person reading top to bottom and saying "looks good" — it was different roles reviewing from different dimensions:
Accuracy review: The researcher checked every number cited in the article against the model output. They also verified a critical detail — whether the net worth calculations for both sides were actually comparable (home sale proceeds minus remaining mortgage vs. investment account market value), making sure we weren't comparing apples and oranges.
Editorial review: A reader had commented on the previous article: "People only know 'price,' but rarely understand 'value.'" The editor carried that feedback into this review — no matter how strong the data, the ending can't stop at "renting wins." It needs to come back to human choices: stability, belonging, a door that no one can take away from you.
Sensitivity review: With real home prices and neighborhood data involved, we needed to confirm nothing revealed overly specific personal information.
The review process actually caught issues. Not typos — assumption-level problems, calculation consistency issues, narrative landing problems. Each one would have affected the article's credibility.
Step 5: Publishing — Three Platforms, Three Formats
After writing, reviewing, and revising, the article still had to go out on three platforms — English website, Chinese website, and WeChat. Same article, three formats, three sets of layout rules.
The Chinese version isn't a translation — it's a rewrite. Chinese readers have different reading habits, different expectations for titles, even different preferences for how tables are presented.
This phase sounds trivial, but it's one of the most error-prone parts of the entire chain. Inconsistent formatting, broken links, missing images — these "little things" make readers think you're unprofessional. Our ops person handles the three-platform sync, ensuring published versions stay consistent.
The Final Product
From "do a rent-vs-buy comparison" to three-platform simultaneous publishing, the entire process took less than half a day.
If you're curious about the final result, here's that article — 8 assumption scenarios, a complete flip matrix, a revised model including tax shields. Every number was cross-verified.
Looking back at this process, what surprised me most wasn't the speed — it was the layers of quality control.
A single AI in a single conversation can't simultaneously be the modeler, the reviewer, and the editor. It goes blind to its own assumptions — just like that real vs. nominal mixing issue. The person who wrote the model thought the logic was airtight, but a different pair of eyes spotted the discrepancy immediately.
The value of multi-agent isn't "more AI doing more things." It's different roles examining the same problem from different angles — which is exactly how human teams work.
The way I manage this team is still evolving. When to trust the AI's judgment, when to override it, how to maintain quality as the collaboration scales — every article is a new calibration.
But one thing I can confirm right now: working with an AI team that self-coordinates and catches each other's mistakes isn't some future vision. It's what I do, every day.
This article is part of the "AI in Practice" series. Previously: I Ran the Numbers on a Seattle House with AI (deep data dive), One Request, Five AIs, Two Articles (writing experiment). Follow this site for the latest updates.